
- Home
- History
- Operational Examples
- Quarterly Reports
- Final Reports
- Journal Publications
- Conference Presentations
- Conference Posters
AMU Fact
The first phase of the Objective Lightning Probability task resulted in nearly a 50% improvement over the technique being used in 45 WS lightning forecasting operations.
Two Columns
AMU Operational Examples - Objective Lightning Probability
The AMU develops tools and techniques for customer's operational weather analysis and display systems.
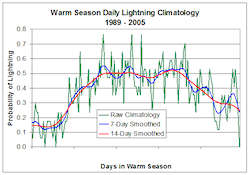
Objective Lightning Probability Seasonal Graph
The AMU staff develops solutions to work with customer's operational systems to include the Meteorological Interactive Data Display System (MIDDS) and the Advanced Weather Interactive Processing System (AWIPS). The AMU has also developed operational tools for customers to use with Microsoft® Excel© and web browsers.
The links below contain select examples of operational tools developed by the AMU for our customers.
| Radar and Outflow Boundary Detection | MIDDS and AWIPS Tools |
| Brush fire results in a tornado at KSC | Anvil Threat Sector |
| Objective Lightning Probability | |
| Excel-based Tool | Web-based Tool |
| Upper-level Winds Assessment | Climatology of Lightning Probability |
Objective Lightning Probability
| The 45th Weather Squadron (45 WS) forecasters include a probability of lightning occurrence in their daily morning briefings. This information is used by personnel involved in determining the possibility of violating launch commit criteria, evaluating space shuttle flight rules, and planning for daily ground operation activities on Kennedy Space Center and Cape Canaveral Air Force Station (CCAFS). |
| The AMU developed a set of logistic regression equations that calculate the probability of cloud-to-ground lightning occurrence (Lambert and Wheeler 2005). These equations outperformed several standard forecast methods used in operations. |
| The results of the logistic regression equations were displayed in a graphical user interface (GUI) in Microsoft® Excel© in the first phase of this project which allowed forecasters to interface with the equations by entering parameter values to output a probability of lightning occurrence. The forecasters had to gather data from the morning sounding and other sources, then manually input that data into the Excel GUI. |
| For the second phase of this project, the 45 WS requested the AMU add warm season (May- September) data from the years 2004 and 2005 to the first phase 15-year 1989-2003 data set. They also requested modifications to the predictors which resulted in improved equation accuracy and also that a tool be developed on the Meteorological Interactive Data Display System (MIDDS) that retrieves the required parameter values automatically for the equations to calculate the probability of lightning for the day. |
| The user accesses the new GUI through the MIDDS Toolbar by clicking on the 'FCST Tools' button and choosing 'Lightning Forecast Tool' from the drop-down list as shown in the figure below. |
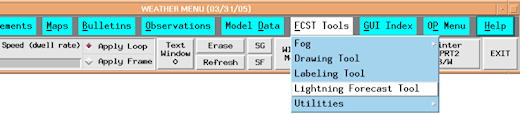 |
| This activates the GUI Tcl/Tk code to determine the date and gather the appropriate data for the equation from MIDDS. The code checks the time and date of the most recent CCAFS sounding (XMR). If it does not match the current day and is not within the time period 0900-1159 UTC, an error message dialog box is displayed as shown below. This ensures that data from the previous day and data from sounding times other than 1000 UTC are not used in the equations. |
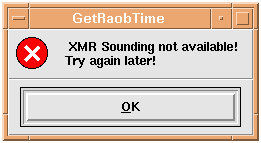 |
| Whether or not the 1000 UTC XMR sounding for the current date is available, the equation predictor dialog box is displayed as shown below. This allows the forecasters to use the GUI to create their seven-day forecasts even if data for the current day are not available. The dialog box has five tabs, one for each month. The tab of the current month is displayed initially. The current month, day and sounding time are printed along the top of the dialog box. If the current day's sounding is not available, 'No Current Sounding' will be displayed in place of the date and time in the upper right. The day value can be changed by the up/down arrows or by entering a value manually in the text box. This allows forecasters flexibility when making the seven-day Weekly Planning Forecast. The sounding date and time is formatted by year, day of year, and UTC time. The rest of the dialog box mirrors that of the Excel GUI (Lambert and Wheeler 2005). |
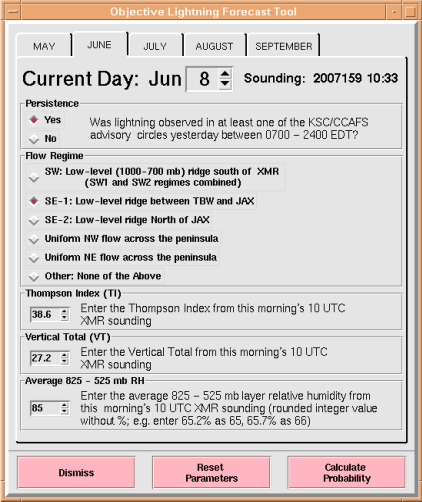 |
| Forecasters begin by choosing Yes or No for persistence, then a flow regime. They do not have to enter the sounding parameters as those values are already input by the GUI code and are displayed in their associated text boxes. If there is not a current sounding, the text boxes will be populated with the values from the most recent sounding available. The 'No Current Sounding' message in the top right corner will inform the forecaster that this is the case. If the routines cannot find a sounding file of any kind, the text boxes will be populated with the extreme low value in the range of available values for each sounding parameter. |
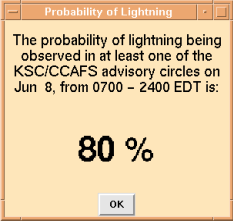
| When the user clicks the 'Calculate Probability' button in the equation predictor dialog box, the probability of lightning occurrence for the day is displayed in a dialog box like the one shown below. The full report for this projects is available here: click for report. |
 |