
- Home
- History
- Operational Examples
- Quarterly Reports
- Final Reports
- Journal Publications
- Conference Presentations
- Conference Posters
AMU Fact
The AMU Anvil Threat Sector Tool was the first AMU tool developed for two different operational systems.
Two Columns
AMU Operational Examples - Anvil Threat Sector Tool in MIDDS and AWIPS
The AMU develops tools and techniques for customer's operational weather analysis and display systems.
Anvil Threat Sector Tool in MIDDS and AWIPS
The AMU staff develops solutions to work with customer's operational systems to include the Meteorological Interactive Data Display System (MIDDS) and the Advanced Weather Interactive Processing System (AWIPS). The AMU has also developed operational tools for customers to use with Microsoft® Excel© and web browsers.
The links below contain select examples of operational tools developed by the AMU for our customers.
| Radar and Outflow Boundary Detection | MIDDS and AWIPS Tools |
| Brush fire results in a tornado at KSC | Anvil Threat Sector |
| Objective Lightning Probability | |
| Excel-based Tool | Web-based Tool |
| Upper-level Winds Assessment | Climatology of Lightning Probability |
Anvil Threat Sector Tool in MIDDS and AWIPS
| The 45th Weather Squadron Launch Weather Officers identified anvil forecasting as one of their most challenging tasks when predicting the probability of a Launch Commit Criteria violation due to the threat of natural and triggered lightning. The Spaceflight Meteorology Group forecasters reiterated this difficulty when evaluating Space Shuttle Weather Flight Rules. |
The AMU originally developed the Anvil Threat Sector Tool for MIDDS and delivered the capability in three phases from 2000 to 2003. In 2006 the AMU migrated the tool onto the AWIPS platform.
|
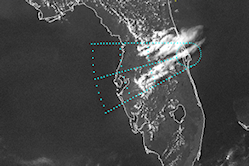
| MIDDS Version |
An example of the MIDDS Anvil Threat Sector Tool is shown in the satellite image loop below. The threat sector region is depicted by the blue cone-shaped region. On this day the anvil-level winds were westerly with an average speed of 49 knots. The endpoint of the tool is located at KSC and the corridor extends from that point westward indicating if thunderstorms formed in the area of the corridor they would move towards KSC.
|
| AWIPS Version |
An example of the AWIPS Anvil Threat Corridor Tool is shown in the satellite image loop below. The threat sector region is depicted by the red cone-shaped region. On this day the anvil-level winds were westerly with an average speed of 25 knots. The endpoint of the tool is located at KSC and the corridor extends from that point westward indicating if thunderstorms formed in the area of the corridor they would move towards KSC. In the example on this day, the Florida peninsula is experiencing strong low-level easterly flow with upper level westerly flow.
|