
- Home
- History
- Operational Examples
- Quarterly Reports
- Final Reports
- Journal Publications
- Conference Presentations
- Conference Posters
AMU Fact
Upper-level wind observations are used by launch teams to determine a launch vehicle's steering, trajectory and maximum dynamic pressure to ensure a safe launch and to place the satellite or deep space probe into the proper orbit.
Two Columns
AMU Operational Examples - Objective Lightning Probability
The AMU develops tools and techniques for customer's operational weather analysis and display systems.
Upper-level Wind Sensors at KSC & CCAFS
The AMU staff develops solutions to work with customer's operational systems to include the Meteorological Interactive Data Display System (MIDDS) and the Advanced Weather Interactive Processing System (AWIPS). The AMU has also developed operational tools for customers to use with Microsoft® Excel© and web browsers.
The links below contain select examples of operational tools developed by the AMU for our customers.
| Radar and Outflow Boundary Detection | MIDDS and AWIPS Tools |
| Brush fire results in a tornado at KSC | Anvil Threat Sector |
| Objective Lightning Probability | |
| Excel-based Tool | Web-based Tool |
| Upper-level Winds Assessment | Climatology of Lightning Probability |
Assessing Upper-level Winds on Day-of-Launch
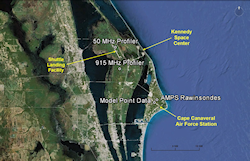
| On the day-of-launch, the 45th Weather Squadron (45 WS) Launch Weather Officers (LWOs) monitor the upper-level winds for their launch customers to include NASA's Launch Services Program (LSP). During launch operations, the payload/launch team sometimes asks the LWOs if they expect the upper-level winds to change during the countdown. The LWOs did not have the capability to quickly retrieve or display the upper-level observations and compare them directly in the same display to the numerical weather prediction model point forecasts. The LWOs requested the Applied Meteorology Unit (AMU) develop a graphical user interface (GUI) in Excel that will plot upper-level wind speed and direction observations from the Cape Canaveral Air Force Station (CCAFS) Automated Meteorological Profiling System (AMPS) rawinsondes located near the CCAFS Skid Strip with point forecast wind profiles from the National Environmental Prediction Center (NCEP) North American Mesoscale (NAM), Rapid Refresh (RAP) and Global Forecast System (GFS) models to assess the performance of these models. The AMU suggested adding observations from the Kennedy Space Center (KSC) 50 MHz wind profiler located adjacent to the Shuttle Landing Facility (SLF) and the 915 MHz wind profiler located south of the SLF to supplement the AMPS observations with more frequent upper-level profiles and the 45 WS agreed. |
| The goal of this task is to build a GUI that allows the LWOs to compare model wind profile output to observed wind profiles closest in time to the 0-hour model forecasts. This allows them to determine which model has the best performance, i.e. to initialize the models. The GUI must also be able to display model forecasts in 3-hour intervals from the current time through 12 hours to be used as a briefing tool by the LWOs. The AMU reviewed the availability of the observational and model data and verified that the observations were available on the Spaceport Weather Data Archive at KSC. The archive consists of all locally collected weather observations at KSC and CCAFS. The model forecast point data for CCAFS (XMR) was available on the Iowa State University Archive Data Server which decodes the model GRIB files and provides them in a format that can be ingested by Excel. |
Graphical User Interface |
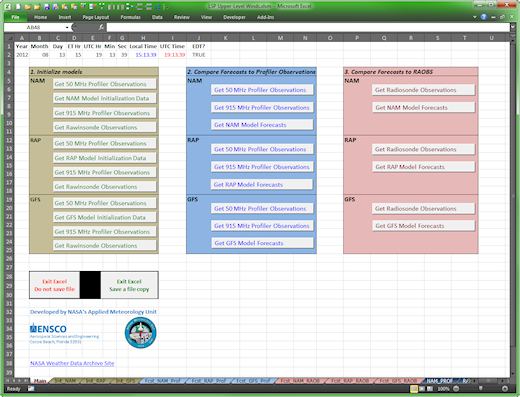
| The AMU developed a menu on the Main tab in the Excel GUI as shown in the figure below. Upon opening the Excel workbook file, the Main tab is displayed and VBA scripts automatically run to determine and display the date, local time, UTC time and the results of the test for DST (Eastern Daylight or Standard Time since the tool will only be used in the Eastern Time zone) in the second row of the worksheet. There are three menus containing user-selectable model data and observations. The first menu, "Initialize models", is designed to allow the LWOs to compare each model's 0-hour forecast to the 50 MHz profiler, 915 MHz profiler and AMPS observations to determine which model is most accurate. The second menu, "Compare Forecasts to Profiler Observations", allows the LWOs to compare each model's 3-12 hour forecasts to the 50 MHz and 915 MHz profiler observations. The third menu, "Compare Forecasts to RAOBS", allows the LWOs to compare each of the model's 3-12 hour forecasts to the AMPS observations. |
 |
Model Initialization |
| For the LWOs to initialize the models against the observations, a VBA script retrieves the latest available model runs by issuing a File Transfer Protocol (FTP) command to download the observations closest to the model time. Since the observations will be compared to the model 0-hour forecasts, the observations should time-match each model's start time as close as possible. The AMU developed VBA scripts to download, ingest and format the profiler and AMPS observations from the Spaceport Weather Data Archive server. The data files on the server are in American Standard Code for Information Interchange (ASCII) format and are ingested into Excel as a text file. After downloading and ingesting the data files, the VBA code removes all unneeded parameters and reformats the data to prepare it for creating charts. |
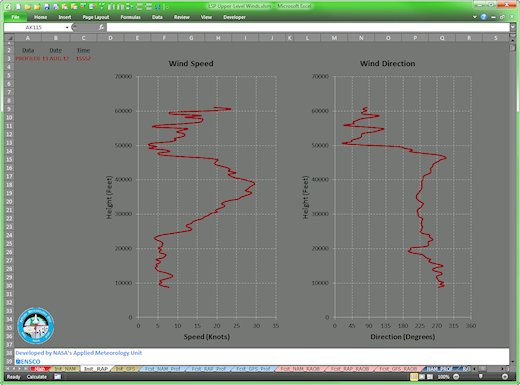
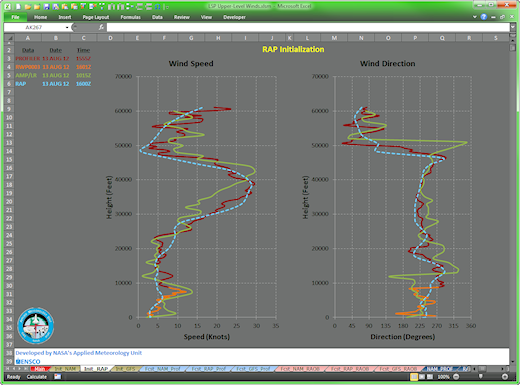
| Another VBA script written by the AMU extracts the observation's height, wind direction and speed, data type, location, date and time from the reformatted data and creates charts containing the vertical profiles of wind speed and direction as shown in the figure below. The data type, date and time of the observation are displayed in the upper left of the chart. The background and profile colors were chosen by the LWOs because they make the display easy to read in an operational setting. |
 |
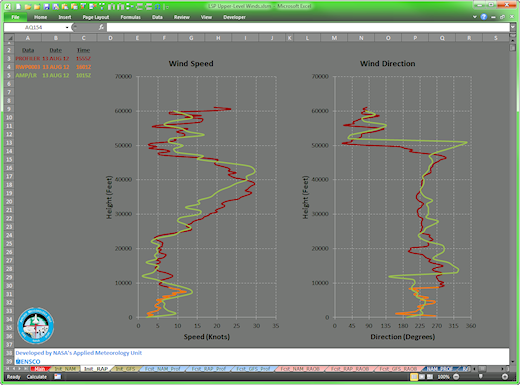
| The 50 MHz profiler collects data from approximately 8,000-60,000 ft while the 915 MHz profiler collects data from approximately 400-10,000 ft. To provide a more-or-less continuous wind profile from these two instruments, the AMU wrote a VBA script to download, ingest and process the 915 MHz profiler files in the same manner as for the 50 MHz profiler files. From the reformatted 915 MHz profiler observations, another VBA script creates wind speed and direction profiles and adds them to the existing 50 MHz profile charts as shown in the figure below. The 915 MHz profiles are shown by the orange lines and the 50 MHz profiles are shown by the dark red lines. The AMU did not interpolate the data at the interface height of the two sensors. |
 |
| Another VBA script downloads, ingests and reformats the AMPS XMR radiosonde observations from the Spaceport Weather Data Archive. The AMPS files are also in ASCII format and are ingested into Excel as a text file. After downloading and ingesting the files, the VBA code removes all unneeded parameters and reformats the AMPS observations similar to the 50 MHz and 915 MHz profiler observations. From the reformatted data, another VBA script creates wind speed and direction profiles of AMPS and overlays them on the existing 50 MHz/915 MHz profile charts as shown in the figure below. The AMPS profiles are shown by the green lines. |
 |
| The AMU then wrote VBA scripts to download and process the model forecast point data from the Iowa State University server. The data files are in ASCII format and ingested into Excel as text files. Each script reformats the files and displays the tabular data to the user. From the reformatted data, the next VBA script creates wind speed and direction profiles of the model forecast point data and overlays the data on the previously-created charts as shown in the figure below. The model profiles are shown by the dashed blue lines. |
 |
Model Forecasts |
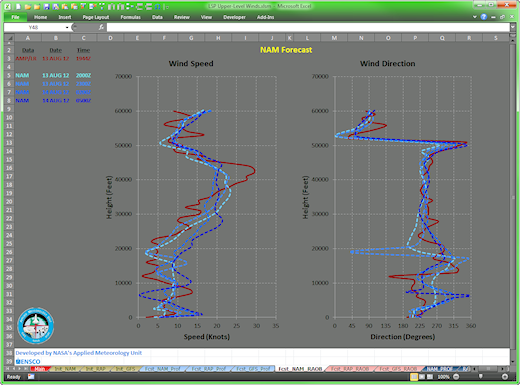
| Since the requirement is to provide the LWOs with a GUI to overlay model forecasts in 3-hour intervals from the current time through 12 hours, the AMU developed VBA scripts to display the forecast wind profiles up to 12 hours after the latest observation at each model's highest temporal resolution to assess the upper-level wind changes on day-of-launch for the launch directors. To keep the forecast charts uncluttered, the model forecast point data is overlaid on the AMPS and profiler observations on separate charts. |
| The VBA script that creates wind speed and direction profiles of the model forecast time intervals also overlays them on the AMPS observation profile charts as shown in the figure below. The AMPS observation (solid red line) at 1944 UTC 13 August 2012 is plotted with the NAM model hourly forecasts (dashed lines) based on the 1800 UTC 13 August 2012 model run valid from 2000 UTC 13 August 2012 to 0500 UTC 14 August 2012 in three-hour intervals. Even though the NAM forecasts are available hourly, forecast profiles valid every three hours are plotted on the chart to reduce clutter. The model forecast profiles are always plotted in four different shades of blue ranging from light (first model forecast valid time) to dark (last model forecast valid time) making it easier for the user to discern between the model forecast valid times. The forecast profile colors match the colors of the text showing data type, date and time displayed on the chart. To unclutter the model forecast profiles, the LWO can right-click on any line and delete it from the chart. |
 |