
- Home
- History
- Operational Examples
- Quarterly Reports
- Final Reports
- Journal Publications
- Conference Presentations
- Conference Posters
AMU Fact
The Climatology of Lightning Probability tool, originally developed for east-central Florida locations, has grown to a peninsular-wide capability.
Two Columns
AMU Operational Examples - Climatology of Lightning Probability
The AMU develops tools and techniques for customer's operational weather analysis and display systems.
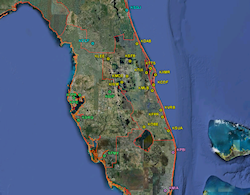
Climatology of Lightning Probability Station Map
The AMU staff develops solutions to work with customer's operational systems to include the Meteorological Interactive Data Display System (MIDDS) and the Advanced Weather Interactive Processing System (AWIPS). The AMU has also developed operational tools for customers to use with Microsoft® Excel© and web browsers.
The links below contain select examples of operational tools developed by the AMU for our customers.
| Radar and Outflow Boundary Detection | MIDDS and AWIPS Tools |
| Brush fire results in a tornado at KSC | Anvil Threat Sector |
| Objective Lightning Probability | |
| Excel-based Tool | Web-based Tool |
| Upper-level Winds Assessment | Climatology of Lightning Probability |
Climatology of Lightning Probability
| The threat of lightning is a daily concern during the warm season in Florida. Research has revealed distinct spatial and temporal distributions of lightning occurrence that are strongly influenced by large-scale atmospheric flow regimes. The 45th Weather Squadron (45 WS), Spaceflight Meterology Group (SMG) and National Weather Service in Melbourne, Fla. (NWS MLB) have the responsibility of issuing weather forecasts for airfields located in central Florida. SMG and 45 WS share forecasting responsibility for the SLF depending on the mission. The 45 WS has forecasting responsibility for the Cape Canaveral Air Force Station (CCAFS) Skid Strip and Patrick Air Force Base (PAFB) while the NWS MLB is responsible for issuing terminal aerodrome forecasts (TAF) for airports throughout central Florida. |
| In 2009, the AMU calculated lightning climatologies for the SLF and eight other airfields in central Florida based on a 19-year record of cloud-to-ground (CG) lightning data from the National Lightning Detection Network (NLDN) for the warm season months of May through September (1989-2007). The climatologies included the probability of lightning at 5-, 10-, 20- and 30-NM distances from the center point of the runway at each site. The climatologies were stratified by flow regimes with probabilities depicted at 1-, 3-, and 6-hr intervals. In 2011, new work updated the previous climatologies by adding 14 sites to the 9-site database including the CCAFS Skid Strip, PAFB and 12 commercial airports. It also added three years of NLDN data resulting in a POR for the warm season months from 1989-2010. In addition to the flow regime stratification, a moisture stratification based on precipitable water was added to separate more active from less active lighting days within the same flow regime. |
The Florida flow regimes used in this work were first described in Lericos et al. (2002) [see full reference in this AMU final report] and modified in subsequent studies as follows:
|
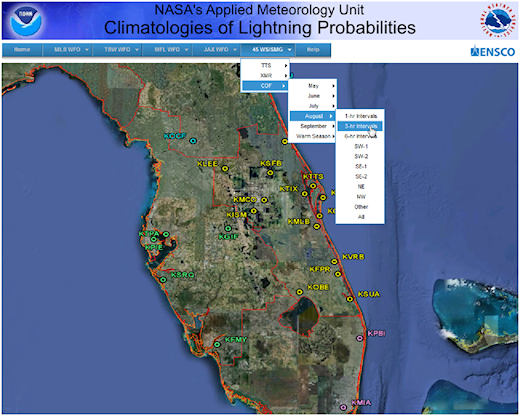
| The climatological forecaster tool resulting from this work provided the meteorologists with a web-based graphical user interface (GUI) written in Hyper-Text Markup Language. The GUI useses a JavaScript drop-down menu that, at the top level, separates the sites by NWS forecast region and 45 WS/SMG sites. When the user rolls the mouse pointer over one of the menu items, subsequent drop-down menus are shown for the different stratifications allowing the user to choose the site, month or entire warm season and time interval or flow regime segregation. The data is presented in tabular and graphical format for each location by flow regime or time interval as shown in the screen shot below. The full report is available here: click for report . |
 |
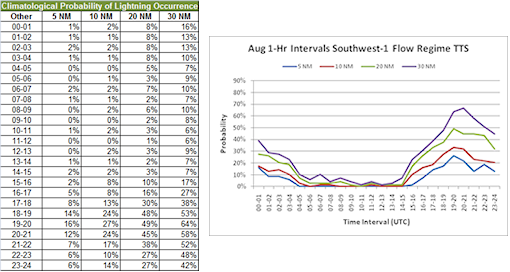
| The data is presented in tabular and graphical format for each location by flow regime or time interval as shown below. |
 |