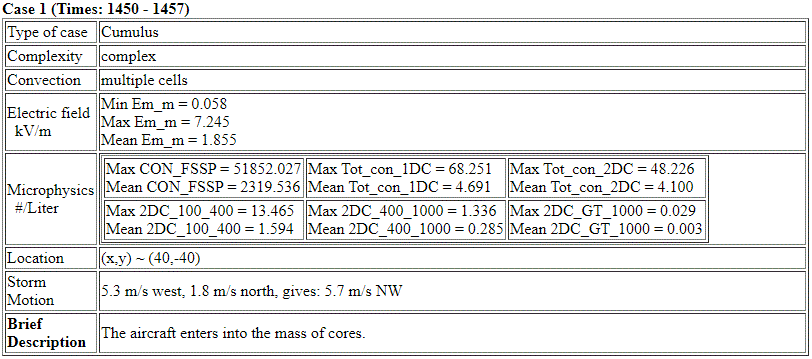
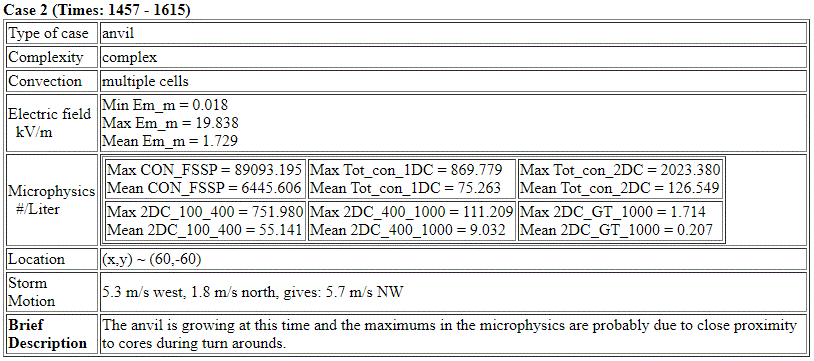
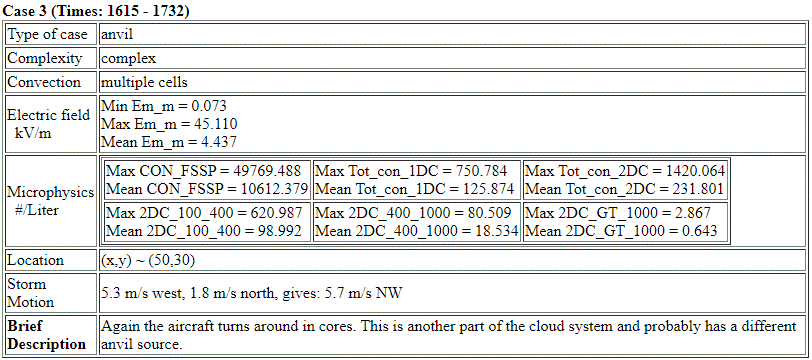
Synthesis for June 27, 2001


Notice that for Case 3 the maximums are less than for Case 2, but the means are larger.
Summary for June 27, 2001
Investigator: (Jim Dye)
CASE 1 (1545 to 1615)
Type of case: anvil formed from maritime cells approaching from ESE with anvils moving off to NNE, later cells develop in a N-S line just E of the coast.
Complexity: distinct, separate anvil formed from one main cell
Convection: Activity nearby throughout the flight
Electric field: moderate near core but weak in the distinct anvil
Precipitation: Precip reaches the ground in main cells
Location: A/C studies start SE of KSC but gradually move to E of KSC
Focus Studies: Spatial study of E fields of an individual anvil
CASE 2 (~1615 to ~1715)
Type of case: anvil formed from complex line of maritime cells
Complexity: complex cellular and anvil structure, periods with precip atten. possible
Convection: Active throughout the flight, but A/C sometimes in anvil
Electric field: Strong to moderate but in some places weak
Precipitation: Precip reaches the ground in main cellls
Location: initially SE of KSC but gradually move to E and then NE of KSC.
Focus Studies: Opportunity to examine Sfc E fields compared to radar aloft.
INSTRUMENT STATUS
WSR74C Radar: might be brief periods with precip atten. after ~1545; need NEXRAD processed to check
NEXRAD KMLB: as of Feb 20, 2003, NEXRAD plots missing from ABFM website
LDAR: normal with some spurious single sources
CGLSS: OK
KSC Ground mills: OK??
Airborne mills: OK
FSSP: OK
2-DC: OK
HVPS: OK
GOES: visible images
BRIEF SUMMARY
A complex of maritime cells moved toward KSC from the SE. The aircraft first investigates the anvil produced by a more vigorous cell of the complex during the period 1545 to 1615 (CASE 1). The last lightning from this cell that formed the anvil was ~1424. By the time the Citation flights in the anvil started one hour later, near 1520 the Electric fields were already weak (<3 kV/m) in areas of the anvil with Box10 avg dBZ < 5 dBZ.
During studies of CASE 2 from ~1615 to ~1715 the Citation flew in complex anvils and sometimes near cells formed from a N-S line of cells just E of the coast and KSC. Precip was often reaching the ground in many of the regions flown in by the aircraft. There may have been some weak attenuation of the 74C signal by intervening precip. NEXRAD plots are needed to check. The most recent Reflectivity Parameter products of Box 10 and Box 5 avg dBZ suggest that there were no violators (ie. points with E > 3kV/m and avg Box dBZ < 5), but some appear very near. So the possibility of attenuation must be checked.
CASE 1 Analysis
A complex cluster of maritime cells were moving towards KSC from the ESE. The A/C first flew through one cell of this system at 1453 to 1457 from 3 to 5 km as it was climbing to higher altitudes. These cells had been fairly intense with lots of lightning somewhat earlier in the cell history from 1335 to 1420. The last lightning in the cell investigated by the A/C occurred in the 1421 to 1424 CAPPI.
http://box.mmm.ucar.edu/webpage/june2001/CAPPI_WSR74C/hc_lightning/010627_G1_WSR74C/010627_152505_74C_lng.gif
http://box.mmm.ucar.edu/webpage/june2001/Mer/010627_G1_WSR74C/010627_1520_1530_WSR74C_MER.gif
During this period of flight in the anvil there were no violators, i.e. periods with Emag >3kV/m but Box5 or Box10 avg dBZ < 5 dBZ.
http://box.mmm.ucar.edu/webpage/june2001/Synthesis/010627/New_mer/Refl_param/010627_1520_1530_WSR74C_REFL_PARAM.gif
[NOTE that this Reflectivity Parameter Plot is the new product which Sharon is now producing. This is work in progress but shows the Box 5 and Box 10 avg dBZ, also the avg Z for Box 10 in the 2nd panel. The 3rd panel shows the Sum of dBZ from 5 km to top of storm in the column of the A/C position. It also shows the Max dBZ in the Box 5 and Box 10 volumes. The Box 5 and Box 10 averages and max values are for altitudes of 5 km and greater.]
The A/C continued to fly in the first anvil until ~1615, but then started flying more to the north of the original anvil to study complex anvils formed from the N-S line of cells.
CASE 2 Analysis
Note in the 1525-1527 CAPPI the line of cells oriented in a N-S direction (perhaps along the Gulf Stream) with the more intense cells with lots of lightning being located at the northern end of the line. This is the beginning of the complex of cells and anvil that the Citation studied during CASE 2. An example of the A/C measurements are shown in the CAPPIs, MER plots and Reflectivity Parameter Plots linked below. Note that the A/C was flying ~30 to 40 km downwind of cells still producing lightning and that the MER plots shows Emag of 10 to 20 kV/m. The reflectivity parameter plot shows that the Box 5 and Box 10 avg dBZ were > 5 dBZ in the regions with Emag >3 kV/m.
http://box.mmm.ucar.edu/webpage/june2001/CAPPI_WSR74C/hc_lightning/010627_G1_WSR74C/010627_163601_74C_lng.gif
http://box.mmm.ucar.edu/webpage/june2001/Mer/010627_G1_WSR74C/010627_1630_1640_WSR74C_MER.gif
http://box.mmm.ucar.edu/webpage/june2001/Synthesis/010627/New_mer/Refl_param/010627_1630_1640_WSR74C_REFL_PARAM.gif
There may have been some intervening precip attenuation for brief periods near 1520, 1530, 1550 to 1555, 1615, 1630 and some weak wet radome around 1640 to 1700. There was no NEXRAD data plotted for the flight period, so must have that before can say more clearly determine if there was attenuation.
Some added links to products which Sharon is exploring are listed below.
applet
Avg_Box_hge5km
Col_avg_ac
MER
Max
Other
Refl_param


