Synthesis for June 18, 2001

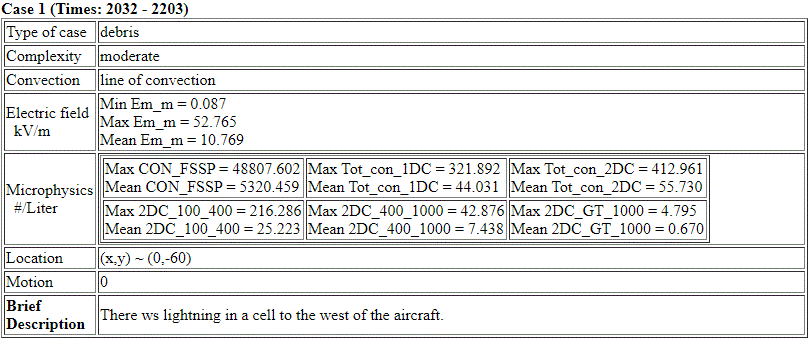
There was 45-50 dBZ reflectivity with lightning in the region the aircraft flew at 1844. There is really no storm motion so this is debris.
Summary for June 18, 2001
Investigator: (Paul Willis)
ANALYSIS:
Beginning about 1900 (4km) , two major cells were developing, one just inland about 50 km S of Patrick, and the second about 140 km S of PAFB on the east shore of Lake Okeechobee. New cells formed between these two, and a more or less continuous line formed south from PAFB and along the east shore of the Lake by 2000 (4km) . By 2015 (4km) a new cell formed inland W of the Cape, and the cells down by the Lake appeared to dominate. The cells just N of the lake became dominant by 2045 (4km) , but a huge stratiform region developed south along the east side of the Lake, and a mostly stratiform line paralleled the coast to a point not far south of Patrick. The active cells continued to develop and move NW and W of the lake, while the anvil/stratiform areas remained in a line and propagated slowly to the east at levels from 7-10 km.
The citation started sampling about 2030 in nominally N-S tracks in these anvil/stratiform areas east and NE of the active convective cells until 2210
A. Lightning
From 2030 the aircraft sampled just on the NE edge of the lightning, with most of the CG strokes to the SW 30 km, in the most active cells. From 2100 to 2130 only the southern parts of the flight legs touched on the lightning. From 2130 on the nearest lightning was well to the West of the flight tracks (50 km). From 2200 to 2210 the last flight legs, the nearest lightning was even further to the WSW (70km).

the W and NW
B. Radar
The echo structure has been described above. The aircraft sampling was at 8 km altitude in the stratiform anvil line extending north parallel to the coast, and in the stratiform regions east of the active cells.

The time history of this system, particularly where the charged hydrometeors were electrified, and transported from, is very complex. This detracts from a straightforward analysis. There seems to be two regimes in the advecting winds measured at the 8 km flight altitude - WNW and NE. One is probably the environmental flow, and the other the flow created by the mesoscale cloud system.
As mentioned last week, the radar scan strategy has shortcomings for producing 10 km CAPPI's., e.g. at 10 km. One scan intersects the cloud at a range, while the next one goes over the top. The overlap, and the voids must be considered when interpreting the data at anvil levels.
C. Electric Field Data
Electric Field
This case is characterized by very strong fields. Of particular interest are the fields after the lightning moves to the west, and some structure at the cloud edges. The fields (Ez) in the first half of the flight are predominantly + ( efield_2100-2115 ) , but in the second half there are interesting reversals. The period from 2150 ( efield_2145-2200) to the end of the flights are quite weak, ( efield_2200-2215) and this may be a good case to look at weakening, although perhaps we are too far east and did not stay long enough. A Lagrangian analysis will tell if this is a good weakening candidate.
D. MER plots (microphysics)
In general the strong fields are well correlated with high radar Z and high concentration of large particles, and total 2DC in this data set from 8km. There are some interesting fine scale exceptions in the details. The fields seem to decrease before the Z decreases, and before the cloud goes away at the cloud edges. At 2054-2059 ( mer_2058 ) there is a period of low Ez with moderate reflectivity factor Z. From 2133 and following ( mer_2130 ) ( mer_2137 ) , Ez goes, then Z goes, then the cloud edge is reached. From 2152-2203 ( mer_2153 ) ( mer_2203 ) Ez is gone, then radar going, and 2DC remains high to the cloud edge.

SUMMARY
I don't think there is any occurrence of High E without nearby high Z
This is a potential case for decay of fields, but the sources of charge centers and the advecting flows may be too complex. It does have fairly extensive sampling in the same area. A Lagrangian analysis is probably needed.


