Synthesis for June 7, 2001


There was quite a bit of lightning in the earlier stages of the flight.
Summary for June 7, 2001
Investigator: (Jim Dye)
Flight Summary
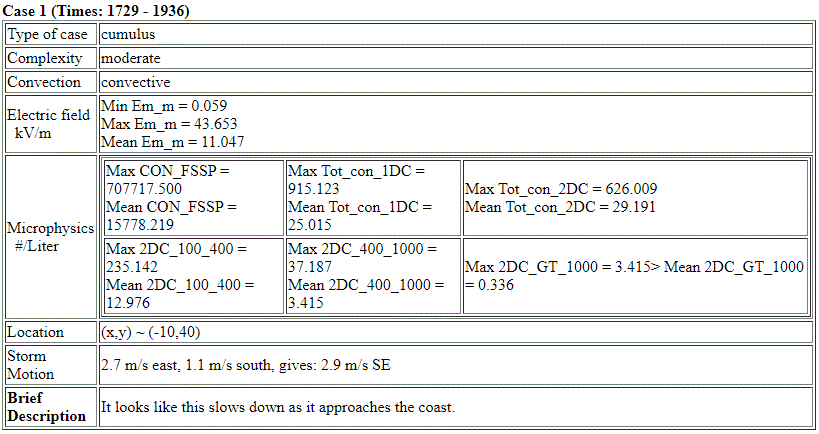
Case 1 (~1737 to ~1935)

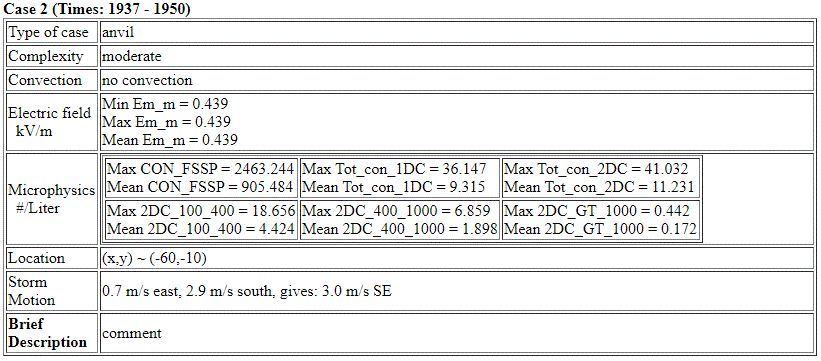
Case 2 (~1936 to 2007)

Instruments

Brief Summary:
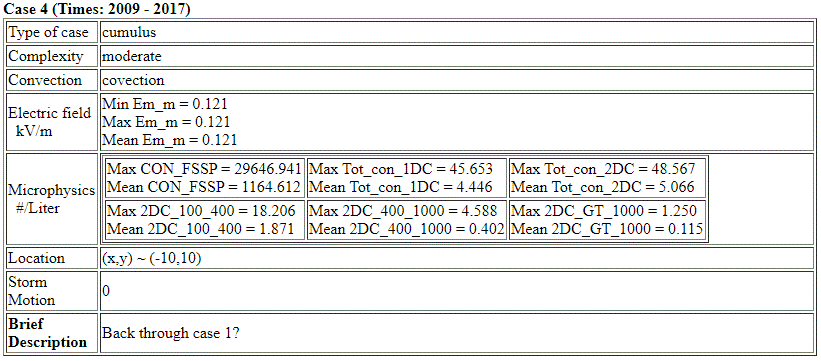
The satellite photos below show a broad area of convection over and to the west of Kennedy Space Center. The A/C worked two different regions of this complex cluster of small but moderate intensity cells which had radar tops at times to 15 km and produced lots of lightning. Case 1 was flown for the most part directly over Kennedy Space Center and the surface field mill network. Passes were made in and out of very active cells in which lightning frequently occurred. Aircraft passes were made first at 7 km and then the aircraft descended to make passes below the active convection at 1.5 km. The E field measurements from these passes should be interesting to compare with the Surface E fields from the KSC network.
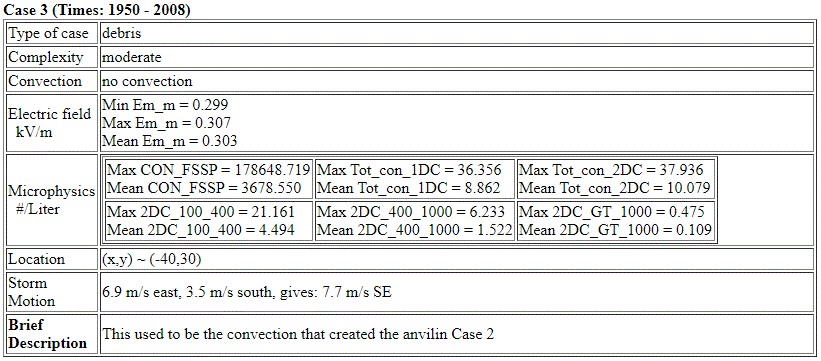
For Case 2 the aircraft studied decaying anvil or debris from previous convection a little west of the active convection of Case I. The electric fields in this region were very weak by the time the aircraft began to investigate it.

METEOROLOGICAL OVERVIEW (LINK to be added)
Case I
1730 to ~1935
From 1730 to 1820 the A/C passes were made at 7 km in different parts of the cellular complex, sometimes over or through the convective cores and sometimes in weaker reflectivities from outflow or anvil. Throughout this period lightning was occurring in the region, sometimes close to the A/C. Consequently E fields were frequently large.
Filtering of the data to remove Citation measurements within +/-20 km and +/-5 min of lightning (any LDAR source or CG flash) removed all points between ~1728 to 1900.
At approximately 1746:28 the aircraft was struck by lightning. As seen in the MER plot below, M_Emag reached a peak of ~75 kV/m and the aircraft was on the edge of a cell with reflectivities of 50 to 55 dBZ at about 5 km. The 1745-1748 CAPPI without lightning shows the aircraft passed almost directly over a small, active cell. The CAPPI with lightning shows both LDAR activity and a CG flash near that location.

The CAPPIs and MER plot below show somewhat typical passes of the A/C as it flew near the active convection and then out to the north in regions of mid and upper level debris with weaker reflectivities and weak E fields.

LOW ALTITUDE PASSES NEAR KSC
Between 1820 to 1830 the A/C descended to 1.5 km where a number of low passes were made from 1830 to 1855 at 1.5 km below or beside the cells. From ~1843 to ~1850 the A/C flew pretty close to KSC, along or parallel to the coast. This may be a good opportunity to compare E fields aloft with those at the surface with substantial radar reflectivity aloft..

Natalie Murray provided this plot showing some of the electric fields measured by some of the KSC field mills. Other plots from Natalie will be added. They show frequent (almost constant) field changes due to nearby lightning.

Case II
~1936 to 2007
This was a study of a decaying anvil in which E fields had already decayed to weak values by the time of the first pass.

The last lightning from the convection which produced this debris was ~1830

So time from last lightning ~1830 to weak E fields is <70 min, (1940 - 1830). However, there had not been significant lightning activity in this anvil debris since before 1710 with most of the active lightning occurring from 1645 to 1700 as this anvil was first being formed.

I have a question on validity of CGLSS flashes for this day/period

SCATTER PLOTS of Emag vs. REFLECTIVITY PARAMETERS
In spite of the aircraft being very near lightning for the first hour and a half of the flight (i.e. until ~1900) and sometimes afterwards as well, the scatter plots for this case are very well behaved.
The plots for the entire flight data set for the Box 5 and Box 10 averages are shown below.

Scatter plots using the filtered data set will be added later.
END OF SYNTHESIS


