Synthesis for May 27, 2001
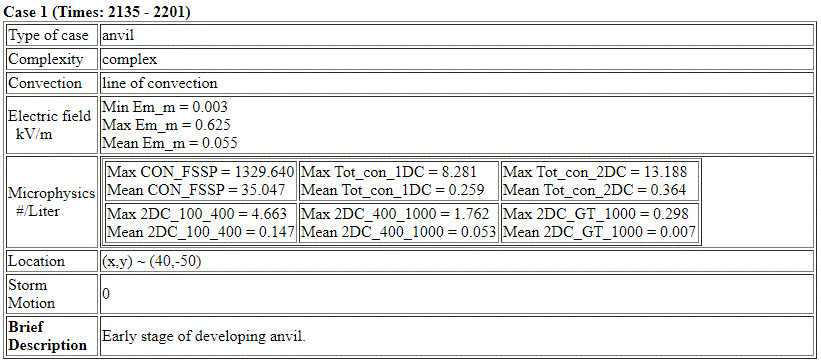
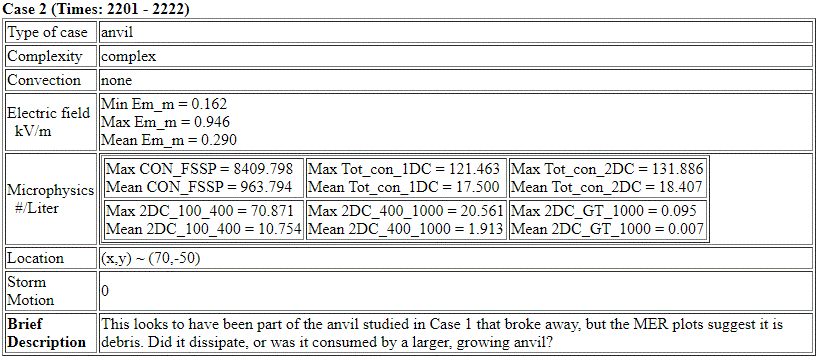
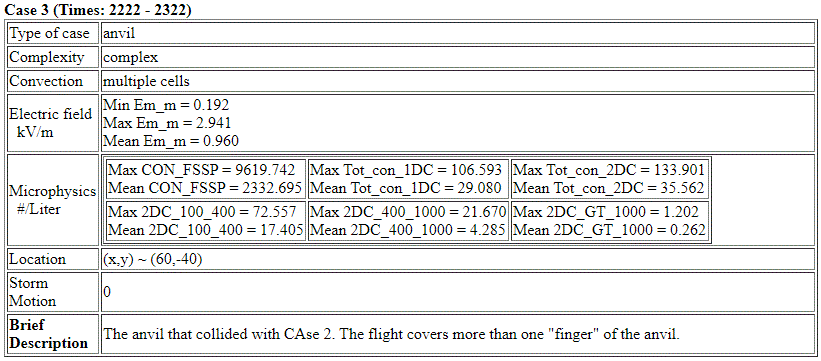
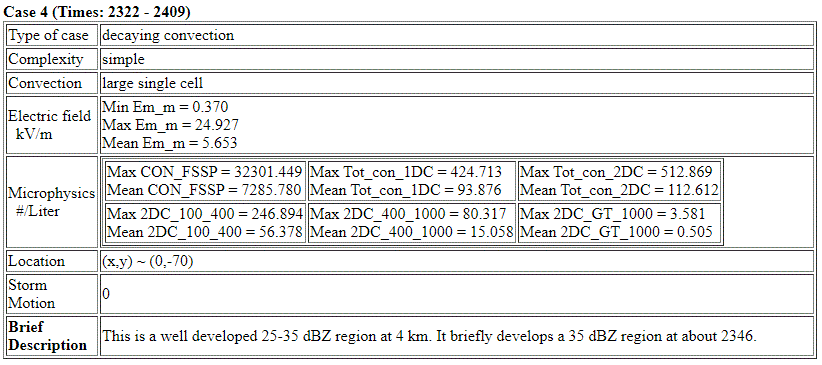
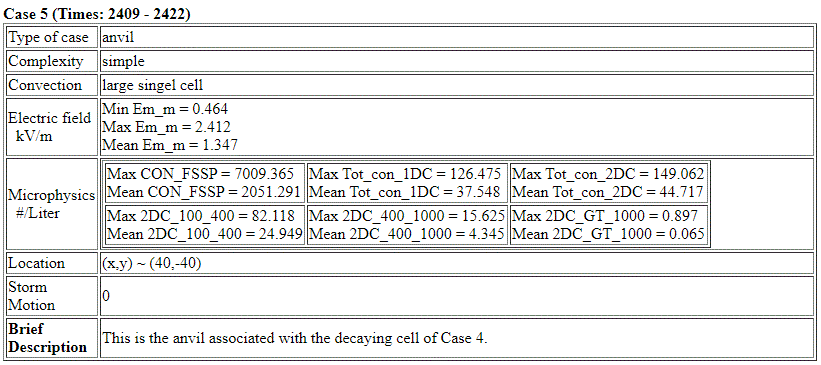
It is not clear how separate these cases are. The convection is roughly stationary and made up of different cells that develop, combine, and separate again, while the anvil(s) come off like fingers at the 7-8 km level.
Summary for May 27, 2001
Investigator: (Monte Bateman)
SUMMARY: (Jim Dye)
During the early part of this flight from about 2140 until 2320 the Citation investigated a weak decaying anvil that contained very weak E fields and weak reflectivity. For examples see the HOR and MER plots for periods around 2227 to 2235 and 2259 to 2307. The main anvil outflow appears to be at ~7 km. The cores which produced the outflow did not show much motion during the investigations.
Beginning near 2320 the Citation starts to make penetrations from the weaker anvil towards the higher reflectivity, convective regions of the storm with strong E fields.
See Monte's plots below which cover most of the period with stronger fields.
Or see HOR for 2330 to 2333 and MER plots for 2314-2322 and 2322-2330 for this first pass.
[As of June 2002 we have added times after 2400 to the MER and HOR plots, which we didn't have at the time of the conference call in Feb.]
This pattern continues until approx. 2400.
During the last pass of the Citation from ~2403 to 2408 in stronger reflectivity the E fields had decayed and become weak.
See HOR 2404-2407 and MER 2402-2410.


