


Synthesis for June 13, 2000
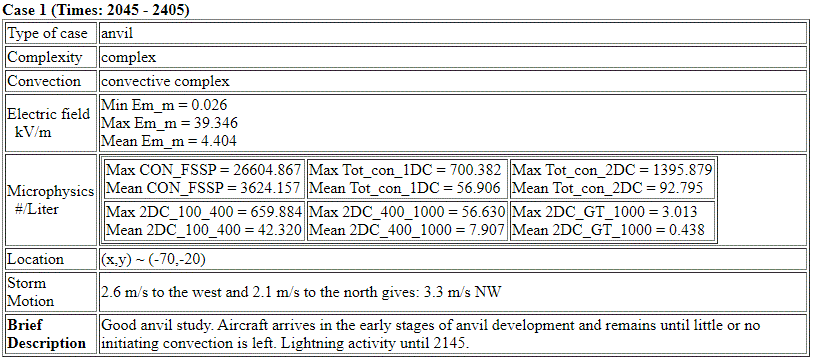
This is an excellent case in which the Citation investigated the anvil of an isolated, electrically active thunderstorm for over three hours starting at a time when the storm was still producing lightning through the time when the fields had decayed to a couple of kV/m. It is also an excellent case for examining the spatial/temporal decay of electric field downwind of the core of a storm.
Summary for June 13, 2000
Investigator: (Jim Dye)
The following summary is from the notes that Jim Dye and Eric Defer put together. Probably early in 2001 (before the May/June 2001 Field Campaign).
This is an excellent case in which the Citation investigated the anvil of an isolated, electrically active thunderstorm for over three hours starting at a time when the storm was still producing lightning through the time when the fields had decayed to a couple of KV/m. It is also an excellent case for examining the spatial/temporal decay of electric field downwind of the core of a storm.
The storm started producing lightning near 1930 about 100 km SW of KSC with an anvil blowing off to the NE. The anvil reached KSC at XXX? as reported by observers at the ROCC. The last CG flash occurred at ~2135, with LDAR sources continuing until 2150 to 2200. LDAR shows sources in the vicinity of the A/C during this period, but we are uncertain of their veracity. [The CTI listing of LDAR status for ABFM 2000 shows electromagnetic interference for this day, but the spatial and temporal coherence of most sources match well with CGLSS reports. Most of the data we find believable.] No LDAR sources are seen in that region after 2200. The core of the storm as viewed by the lightning activity remained in the same location centered near (-80,60) spreading 10 to 15 km away from that center. From ~2045 until 2225 the A/C made E-W reciprocal passes across the anvil while the storm was producing lightning and as the lightning stopped. It then commenced SW-NE passes along the axis of the anvil until about 2355. These passes extended over KSC and the field mill network and were at altitudes of 10.5, 8.7, and 7.9 km.
The E-W passes show strong fields with magnitudes from 10 to 50 KV/m both positive and negative. There is large horizontal variability, e.g. the passes from 2145 to 2200 show Ez as large as +35 and -50 KV/m. The fields diminish to a few KV/m by 2220. This decrease is partially temporal as the storm dies, but also spatial and dependent upon where the aircraft happens to fly relative to the storm.
The NE-SW passes show Ez to be less than 1 to2 KV/m except when flying near and over the decaying core region of the storm, where fields as large as 50 to 60 KV/m were observed. Larger fields in both the E-W and SW-NE passes tend to be associated with higher reflectivity at and below the aircraft. On the NE-SW passes the fields rapidly increase as the A/C approaches the higher reflectivity, but are weak and relatively uniform until that point. The measurements suggest that the charge causing the larger fields resides on falling precipitation below the aircraft.